The following maps outline the methodology used to identify woodland opportunity. This broad methodology applied both in the Chew Valley and at the broader national scale for England. An interactive web map for all of England can be found on the Friends of the Earth web site.
Location
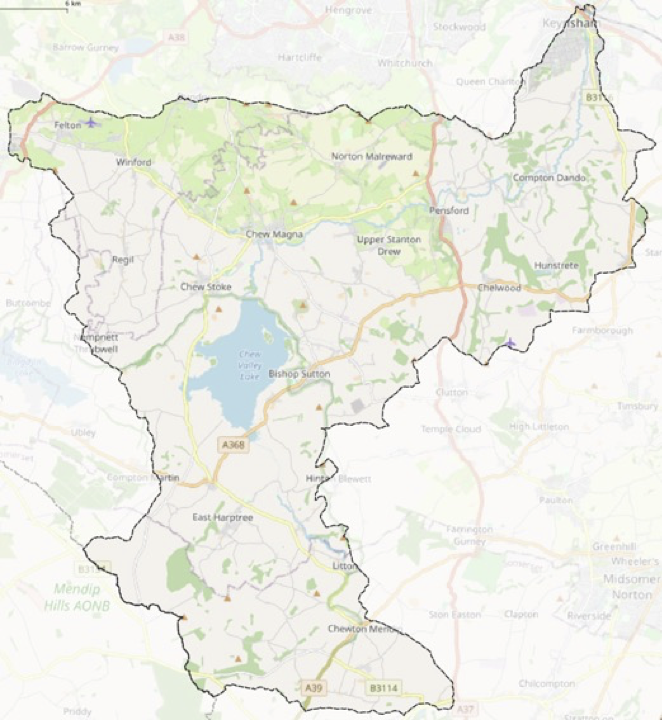
The Chew Valley is located south of the City of Bristol.
The valley is a hydrological unit with an area of 14,329 hectares.
The northern portion is in the Green Belt, whilst the southern portion is in the Mendip Area of Outstanding Natural Beauty.
There are 32 parishes in that intersect with the valley
openstreetmap.org
Woodland Resources
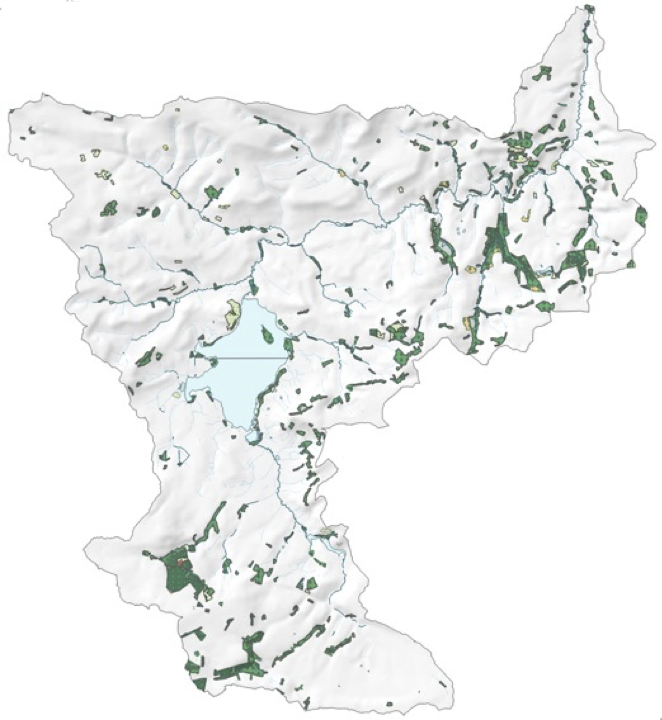
According to the National Forest Inventory (NFI) 2018 there are approximately 950 ha of ‘woodland’ in the Chew Valley.
NFI defines woodland as areas greater than or equal to 0.5 ha with canopy cover of 20% or more.
This represents 7% of the land area of the Chew Valley and is approximately half the national average.
The woodland that exists is a mix of broadleaved woodland and conifer plantations. Much of the woodland is in small fragmented patches.
NB The NFI definition ignores small-woods (<0.5 ha), hedgerows and individual trees. It does this to be comparable with other national inventories and reporting commitments.
Data from the Forestry Commission, OGL
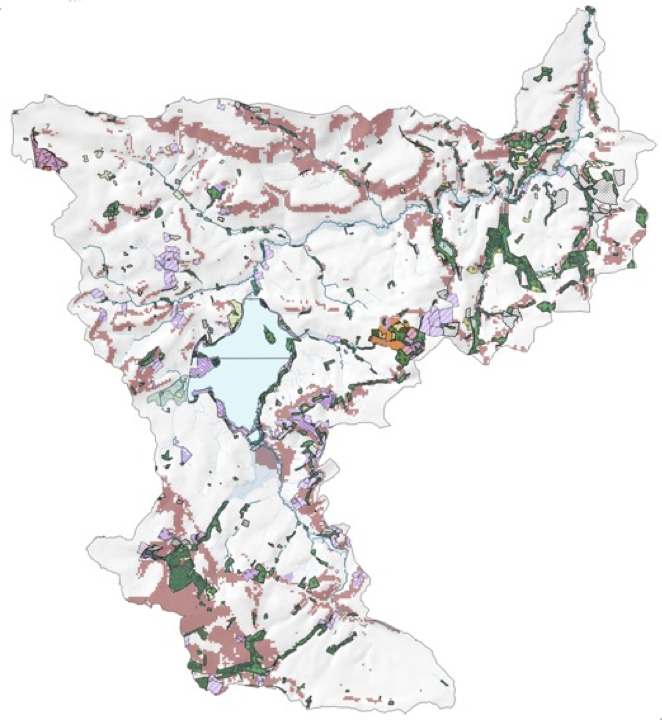
Priority Habitats
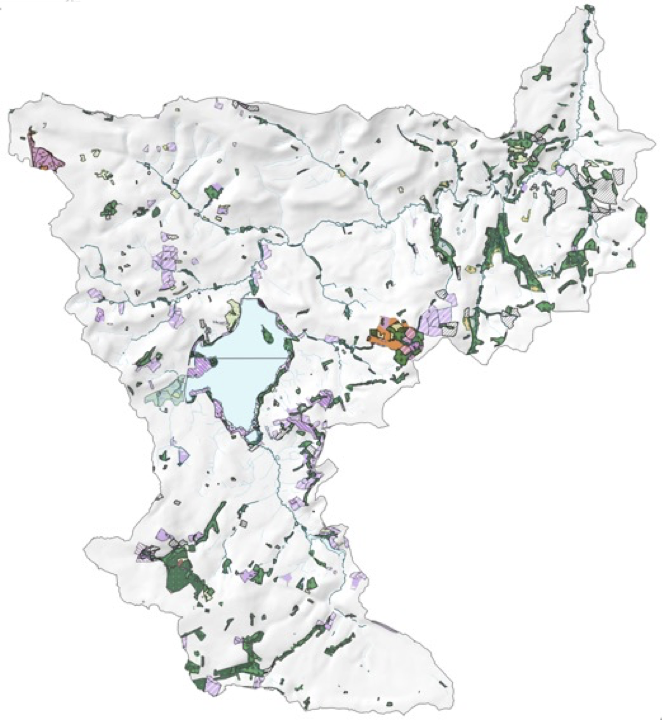
We don’t want to suggest planting trees on protected areas and valuable priority habitats
The Chew Valley Lake is a site of international importance for birds and is well protected
There are a number of Sites of Special Scientific Interest in the valley
Priority habitats such as good quality semi-improved grassland do occur in the valley, but this information may incomplete and out of date.
Local knowledge and ecological surveys are needed to confirm status
Data from Natural England, OGL
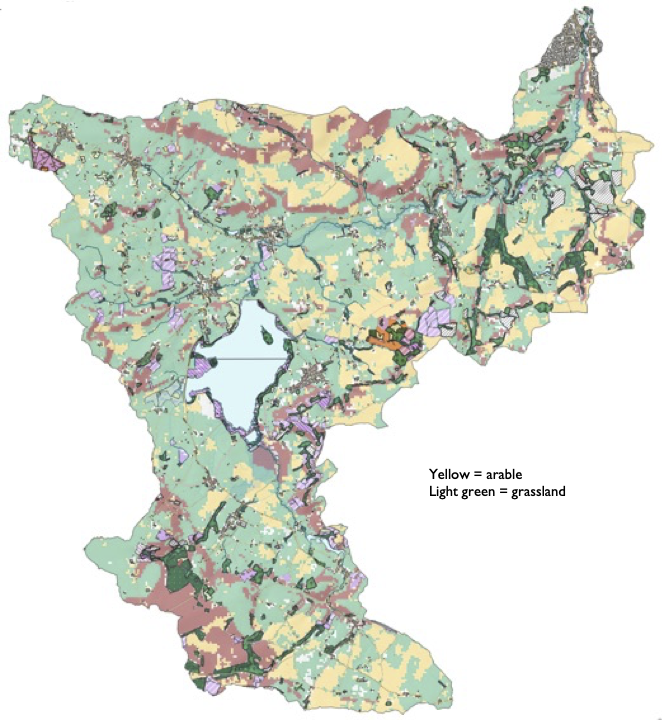
Land Cover
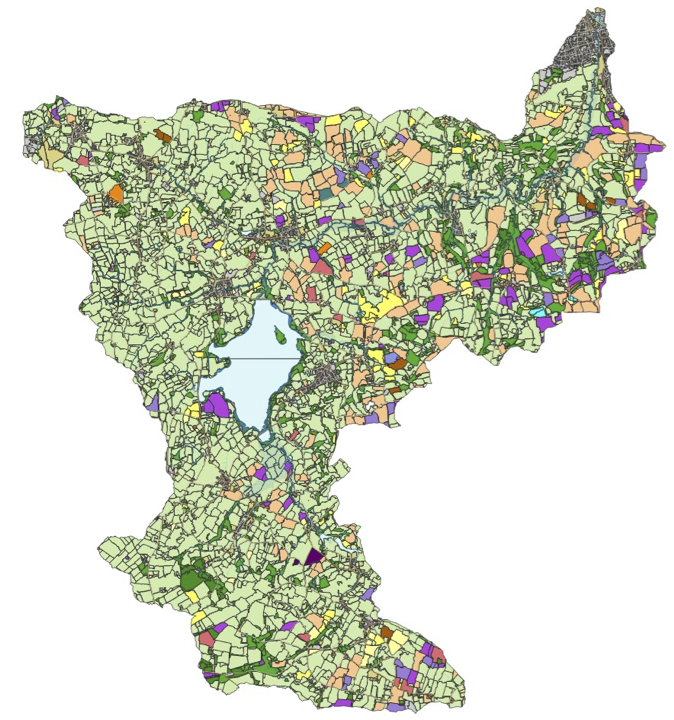
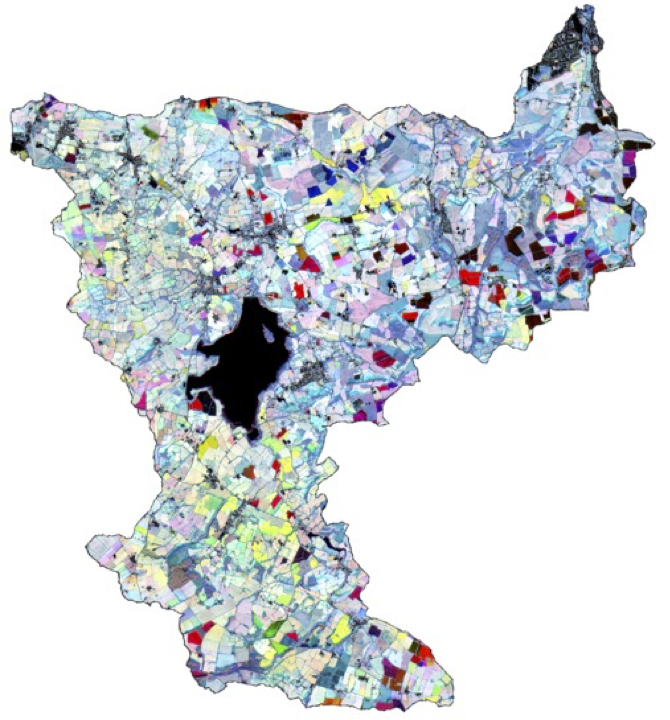
To avoid arable agriculture first we need to know where it is. We used multitemporal Sentinel-2 satellite imagery from 2019 to classify the Chew Valley’s land cover into arable crops and grassland. This map shows the result with grassland in light green, woodlands in dark green and arable crops in various bright colours.
Some grassland is actually part of the arable crop cycle and needs to be accounted for as arable.
For Chew Valley we used Sentinel-2 satellite imagery from 2019. For England as a whole we used four years with of DEFRA Crop Map of England (CROME) data to improve differentiation between temporary and persistent grassland. The CROME map is also derived from Sentinel-2 data.
Copernicus Programme
Teasing Out Grasslands
Knowing the characteristics of grasslands is difficult without a field visit and talking to the land owner. We have used priority habitats as a best proxy, but this is not perfect. Biodiverse grasslands are managed differently to improved grassland and are mown at different times of year. It may be possible to tease out which grasslands are mown as traditional meadows from multi-temporal vegetation index imagery.
This image shows vegetation index data for three times within the same year, displayed as red, green and blue. Cover that is photosynthetically active early in the year comes out as red, late in the year as blue. Grass may be green all year and will come out as grey. Variations in the tones of grey probably relate to grassland management and the timing of mowing – wherein lies knowledge of the type of grassland. This, however, remains an area of research.
Copernicus Programme
Agricultural Land Classification
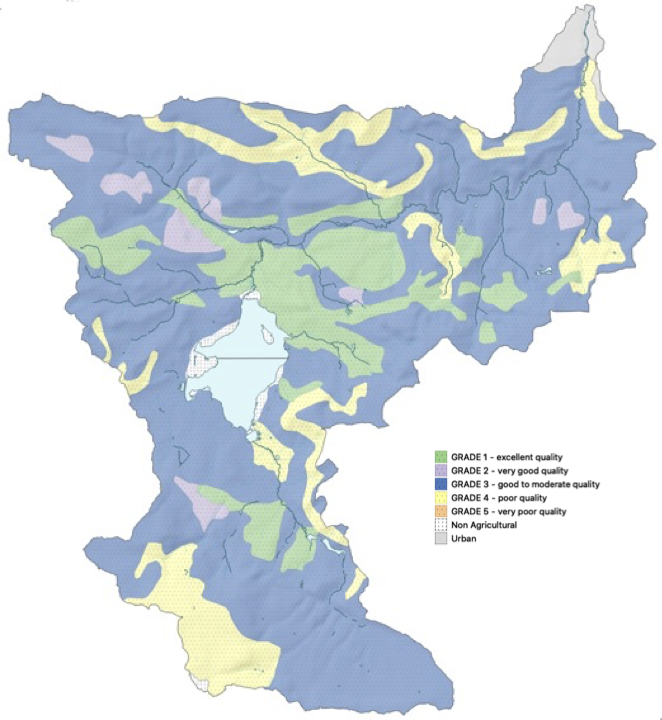
Chew Valley has some very productive agricultural land including excellent and very-good quality Grade 1 & Grade 2 land, according to the national Agricultural Land Classification (ALC) map. Arable land tends to be on grades 1 and 2.
The Chew Valley also has much good to moderate quality Grade 3 land which tends to be grassland but also includes some arable.
There is some poor-quality Grade 4 land and land on steep slopes. No Grade 5 land occurs in the valley.
The ALC specification also includes 3b, although it is not included in the DEFRA map.
DEFRA, OGL
ALC Grade 3b
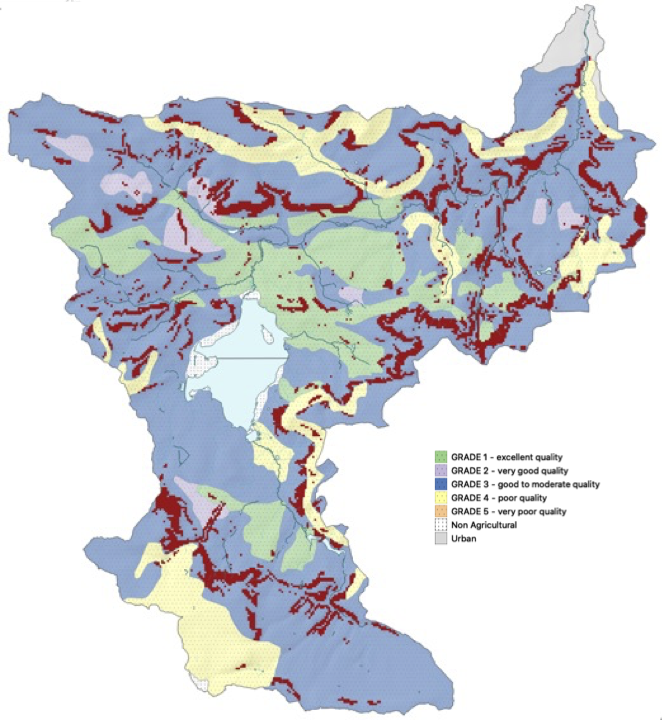
Land on steep slopes is not depicted on the DEFRA ALC maps. This is an omission.
Steep slopes (shown in red) can be identified using open OS data and used to augment the ALC maps to include Grade 3b. This identifies more space for Opportunity Woodland, providing more choice.
“Grade 3b – Moderate Quality on steep slopes where it may be difficult to operate machines and there may be an attendant risk of soil erosion”
Including 3b makes more space that could be considered for woodland creation.
DEFRA, Ordnance Survey, OGL
Methodology
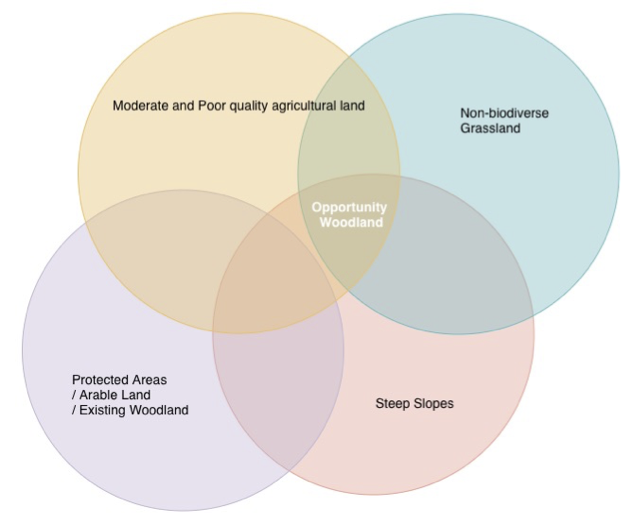
The methodology is quite straightforward and uses Open-Data to identify land which is:
- On moderate or poor-quality agricultural land
- Not arable agricultural land
- Not existing woodland
- Not residential or urban land
- Not protected area such as SSSI, Special Protection Areas, Local or National Nature Reserve, Scheduled Monument
- Not on steep slopes
- Not biodiverse grassland or priority habitat
This land that satisfies these criteria is identified as ‘Opportunity Woodland’ – i.e. land where tree planting might be considered by land owners.
Woodland Opportunity
The baseline woodland area (2018) is 928 ha
Scenario 1
Utilising Grade 4 land (Scenario 1) for woodland there is space for an additional 1,223 ha of woodland
Scenario 2
Utilising Grade 4 and Grade 3b land (Scenario 2) for woodland there is space for an additional 2,242 ha of woodland
If all of the red opportunity area was converted to woodland there is more than enough space to double woodland cover in the Chew Valley. In addition there is also space for agroforestry.
Agroforestry
Both arable and grasslands can host trees in the landscape, in hedges, as lone trees and as patches of small woods. They can also host trees as components of Agroforestry systems: silvoarable and silvopasture.
This map shows the arable land as yellow and pasture as light green. Agroforestry could be developed in these areas as well as in the woodland opportunity areas in red.
It is difficult to explicitly map these areas other than to state a stocking density. A set of parish maps has been prepared that includes the opportunity woodland and agroforestry potential for each parish in the valley.
Natural England, Protected Habitats, DEFRA CROME Map, OGL
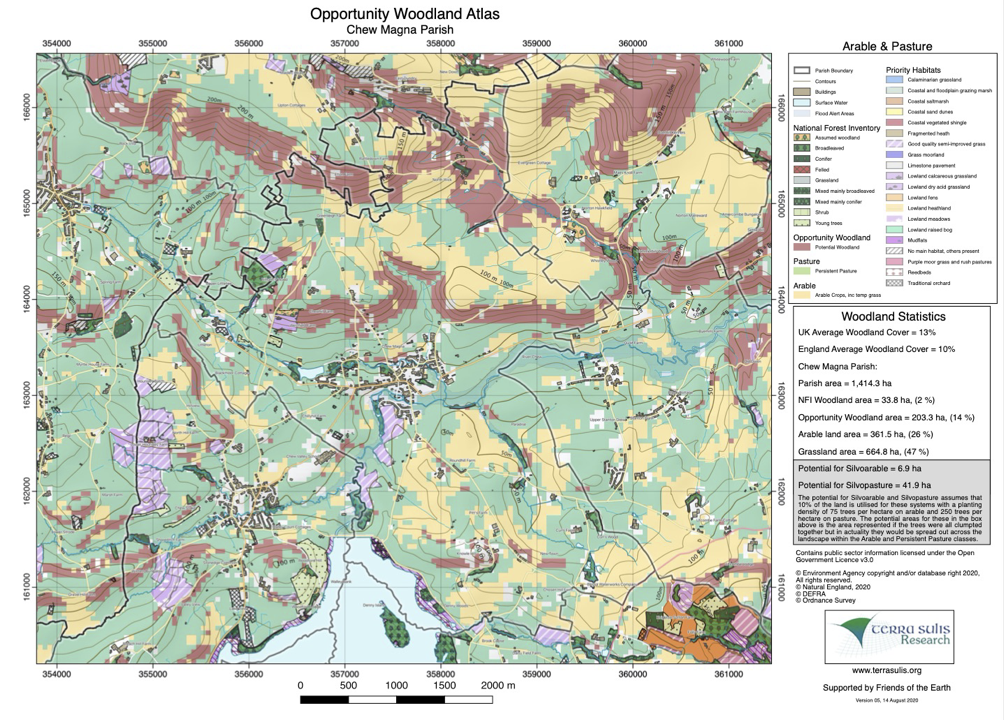
Parish Maps
An atlas of 6 maps per parish has been generated
This map shows the distribution of Opportunity Woodland (red), protected areas (purples), existing woodland (greens), arable land (yellow) and grassland (light green)
It is based on a 50m grid
Estimates of existing and potential woodland area are given in the information box
Natural England, Protected Habitats, DEFRA CROME Map, OGL
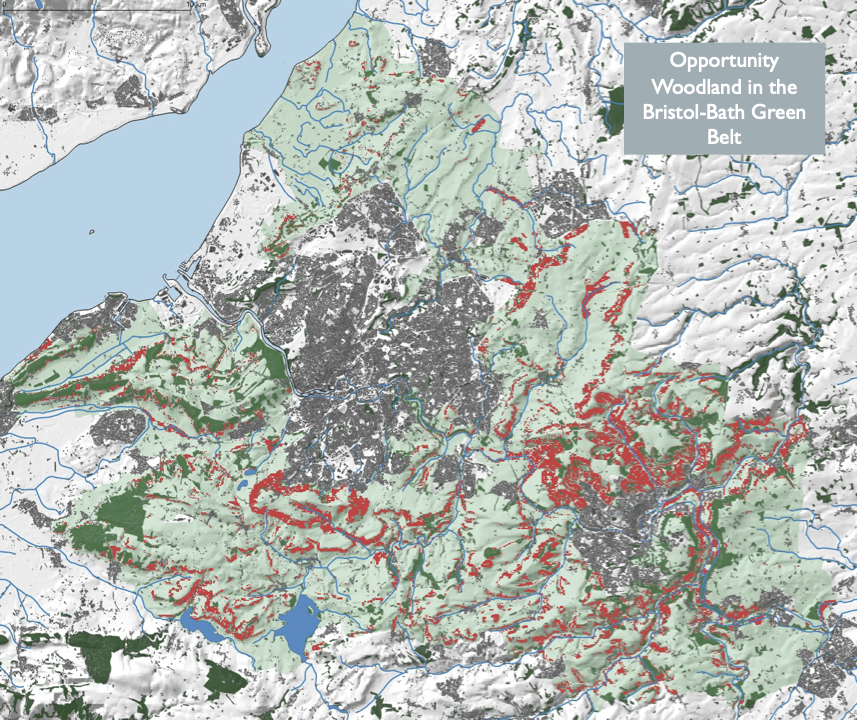
Broader Context
Extending the Chew Valley methodology to the Bristol-Bath Green Belt shows that it is landscape specific – some places have more woodland opportunity than others.
Those places with little or not opportunity woodland will have other possibilities to increase tree cover, based around different types of agroforestry.
Forestry Commission, Ordnance Survey, Terra Sulis, OGL
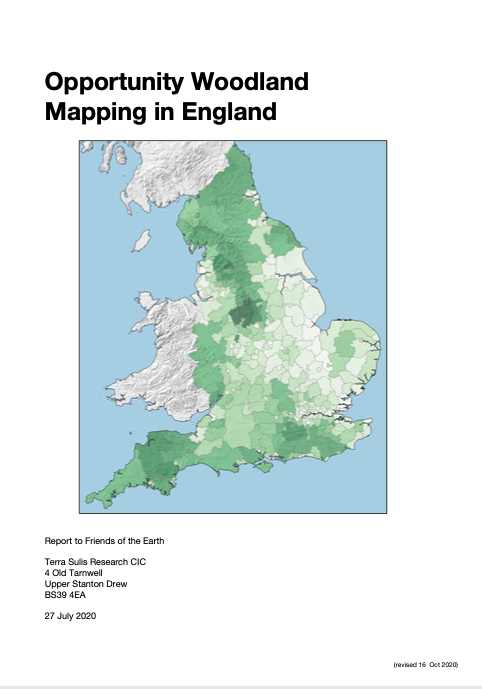
Even Broader Context
The even broader context is all of England. You can find the Woodland Opportunity Map as part of on interactive website with Friends of the Earth