The general lack of vegetated surfaces, the high thermal inertia of artificial surfaces, and the concentration of heat generating activity, means that urban areas suffer from the Urban Heat Island (UHI) effect.
Artificial surfaces, such as asphalt and concrete, absorb and store large amounts of heat. The reduced level of vegetation, compared to rural areas, means that there is less cooling from evapotranspiration. The concentration of energy use in urban areas, such as the burning of natural gas and petrol and the use of electricity, increases ambient heat. Having said that, the incoming solar radiation represents a significantly larger amount of energy than that used by manmade technology (a ratio of approximately 20 to 1 for London).
Urban trees and greenspaces can provide important cooling effects within the urban environment. The main ways in which urban trees and greenspaces affect the local energy balance are through evapotranspiration, shading and reflection of solar radiation.
Terra Sulis worked with Friends of the Earth to implement the Forest Research empirical urban cooling model described by Vaz Monteiro et al. (2016). This model is for greenspaces and we have extended it to also include urban street trees. There are two primary input data sets which are the LiDAR tree canopy map and green vegetated areas taken from the CEH Land Cover Map, Marston et al. (2022). The CEH data were used because they represent areas of photosynthetically active green vegetation. They are literally ‘green’ spaces, as opposed to other data sets that may include artificial sports grounds.
Cooling by Greenspaces
To model the cooling effect of greenspaces, the equations derived in Vaz Monteiro et al. 2016 were used. This study involved empirical data collection at eight greenspace sites in London. Temperature sensors and data loggers were installed along transects from the centre of the greenspaces, going out to 250m from its boundary. Temperature data was collected and compared to a reference. For practical reasons the data were collected on calm warm nights. However the greenspaces continue to provide a cooling effect during the day and under other conditions. The results can be seen as indicative of the cooling amounts and cooling distances for varying size of greenspace. They do not capture the nuance of how this varies over time and under different meteorological conditions.
The two key equations used from this paper are:
Cooling Distance = 22.63 x Greenspace Area + 4
Cooling Amount = 0.51 (Greenspace Area) ^ 0.2 – 0.03
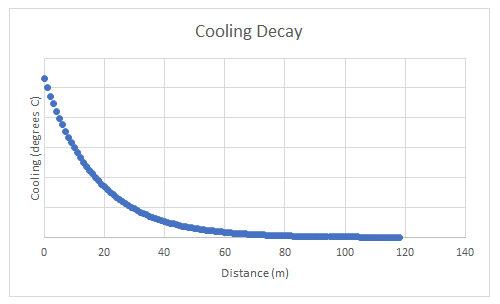
These equations were arrived at inductively, based on the best fit curves for the datasets collected. An example cooling function for a greenspace with an area of 1.6 hectares is given below.
The general implementation method for greenspaces is as follows:
- Each greenspace in the area of interest is considered in turn
- The greenspace size is calculated
- The cooling amount and distance are calculated for that specific greenspace based on its area
- A cooling “ramp”, with 10m increments, is calculated in all directions from the greenspace out to the cooling distance
- For each location in the study area, the distance from the greenspace is calculated and the appropriate cooling ramp value is applied to derived the cooling due to that individual greenspace
This is done for every greenspace and is very computer-intensive ! Large greenspaces have large cooling distances.
Cooling by Street Trees
The LiDAR tree map is used to calculate the volume of street trees. Assuming that the volume is linearly proportional to Leaf Area Index and evapotranspiration, and to a lesser extent shading, we have used tree volume as a measure of cooling capacity of trees outside of greenspaces.
As with greenspaces, the further you are away from a street tree the lower the cooling effect. The cooling amounts by trees have been calibrated based on the Vaz Monteiro data.
The Urban-Rural Boundary
The model, and the map expressions of it below, relate specifically to the cooling effect of urban greenspaces and urban street-trees. In rural areas the cooling effects of greenspace and trees is much greater than within the urban zone. Please note that rural areas are not included in the model as they are effectively one huge greenspace. The model deals only with the effects of urban greenspaces and urban street trees. The consequence of this is that towards the edge of the urban area there is only an urban cooling effect from the urban side and none from the rural side. For this reason the maps might appear to get “warmer” (i.e. less cool) towards the edge. In reality the rural cooling effect probably counterbalances this apparent reduction in cooling towards the edges.
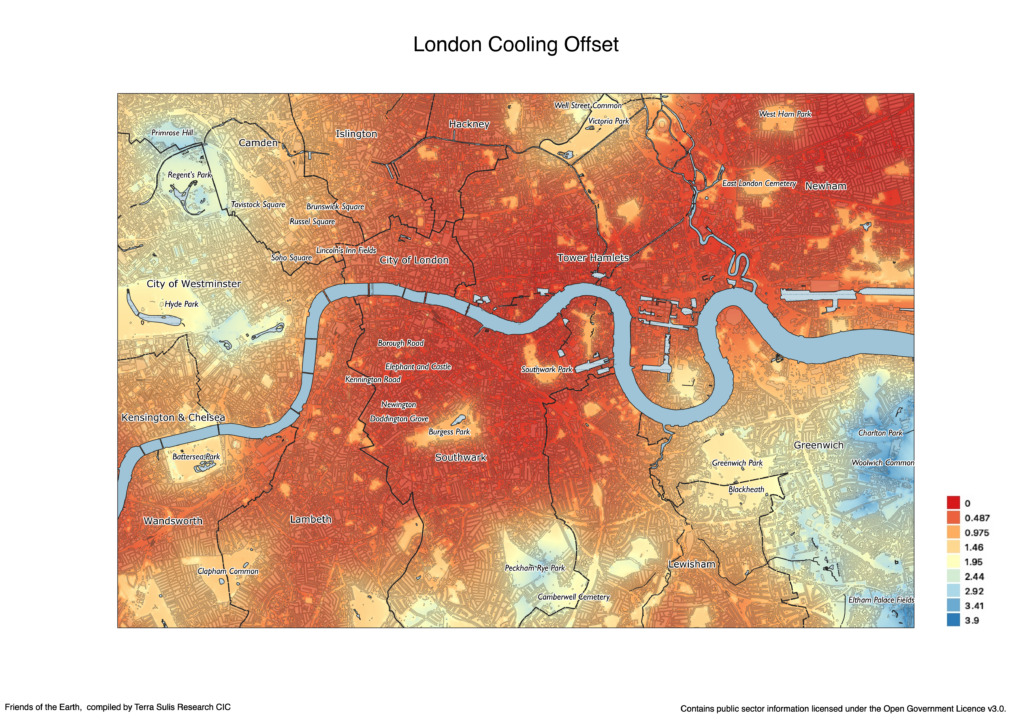
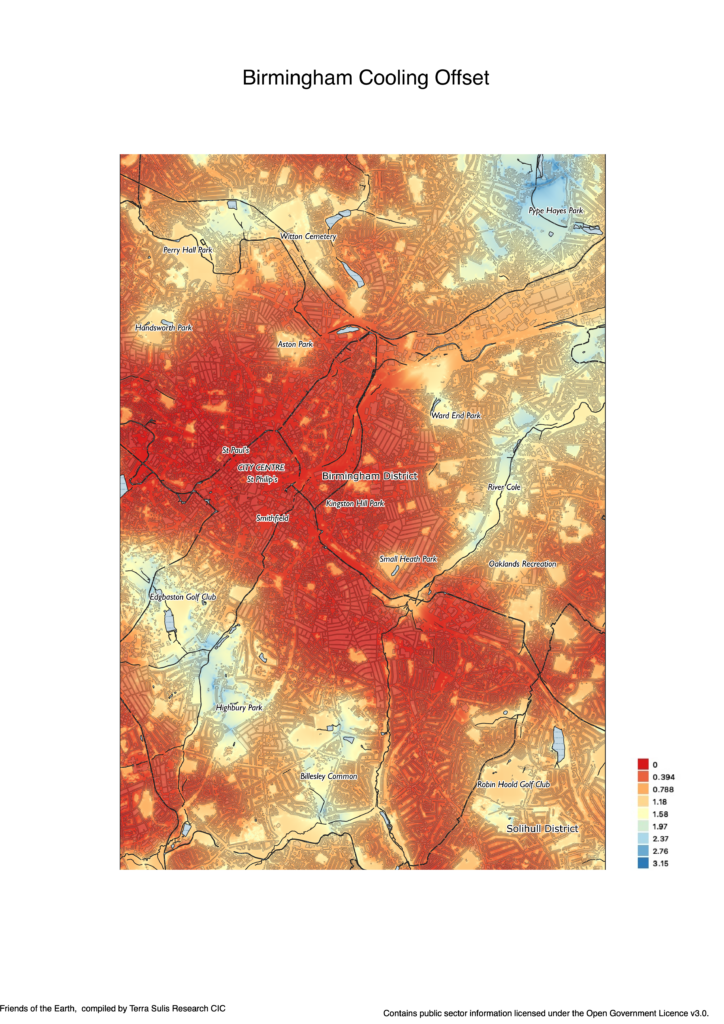
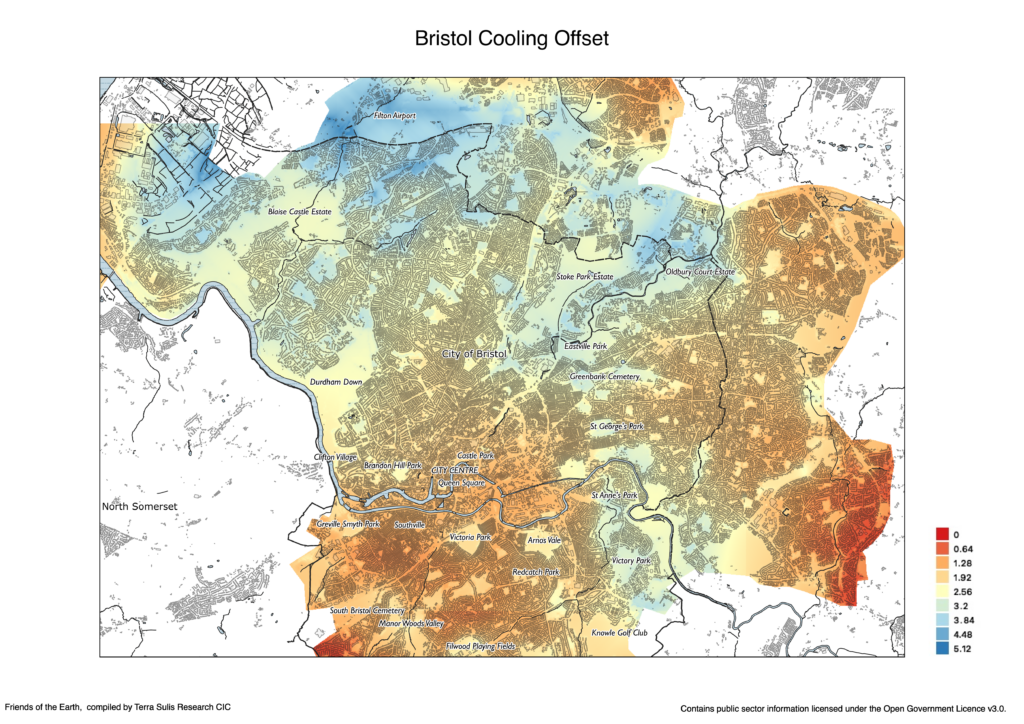
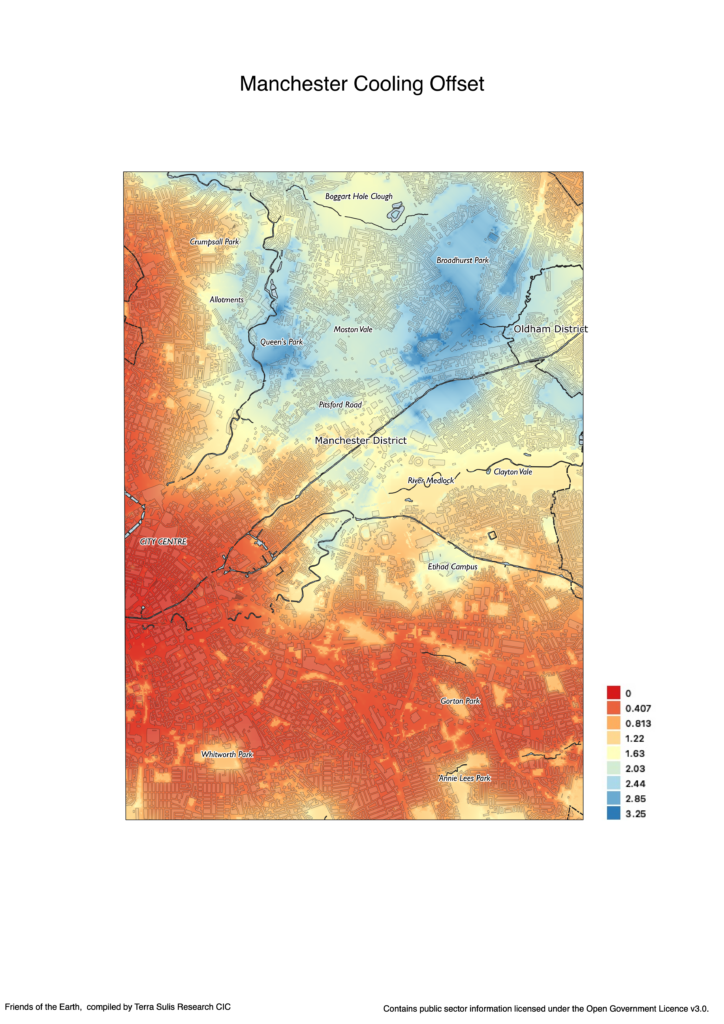
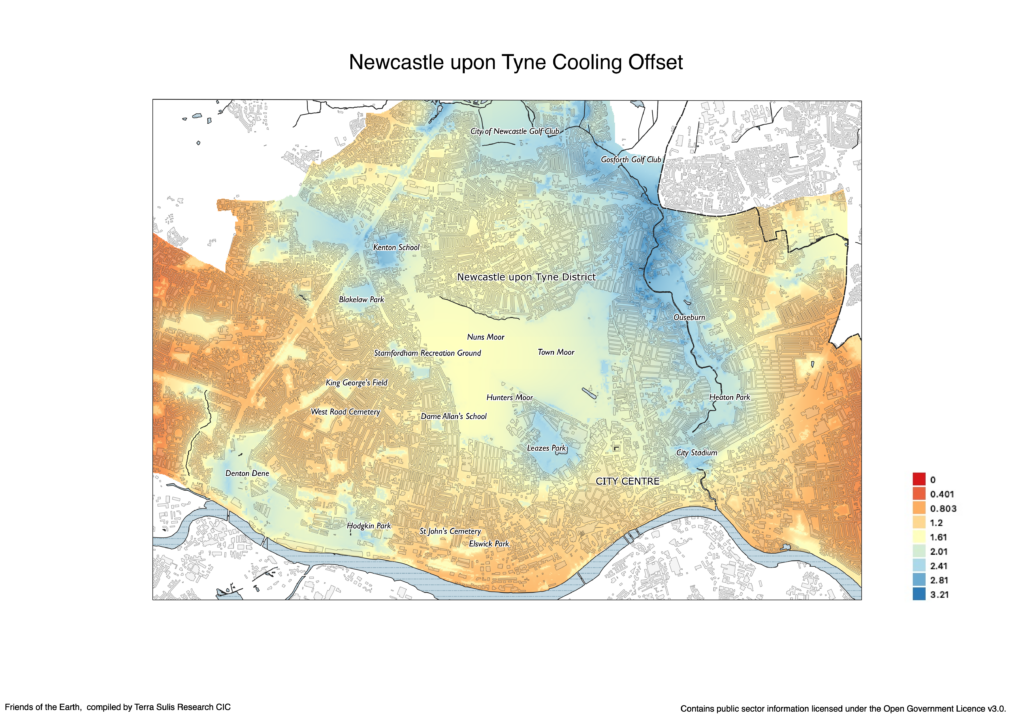
Model Outputs for Five Cities in England
Below are cooling maps for parts of five cities in England. Note that they are expressed as cooling offsets in degrees Centigrade. Please also note the section above on the urban-rural boundary.
References
Marston, C., Rowland, C. S., O’Neil, A. W., & Morton, R. D. (2022). Land Cover Map 2021 (10m classified pixels, GB) [Data set]. NERC EDS Environmental Information Data Centre. https://doi.org/10.5285/A22BAA7C-5809-4A02-87E0-3CF87D4E223A
Vaz Monteiro et al, 2016, The impact of greenspace size on the extent of local nocturnal air temperature cooling in London, Urban Forestry and & Greening.