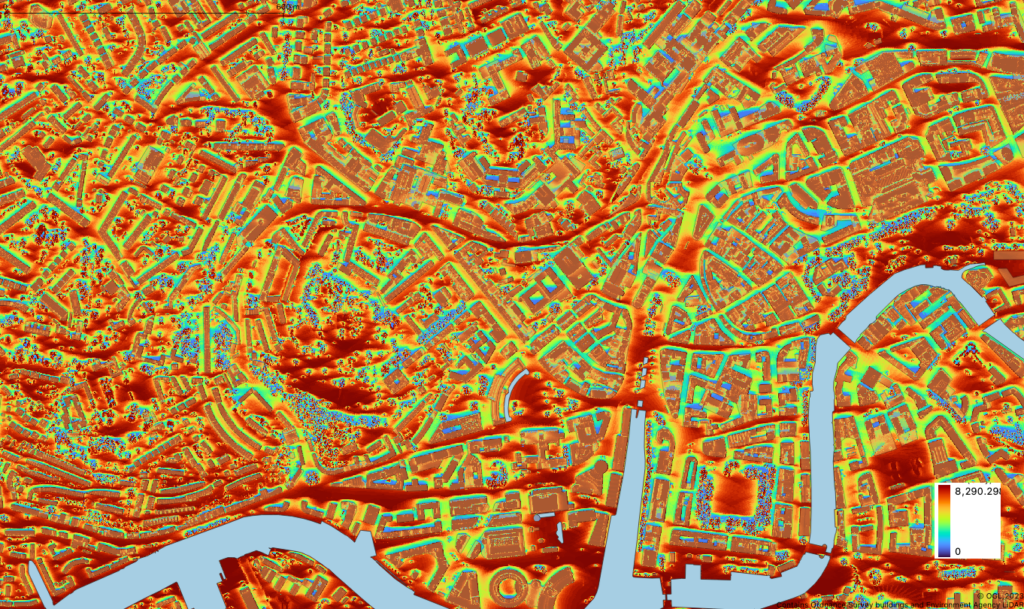
In parallel with the urban cooling work we have developed maps of solar irradiation / shading based on the Environment Agency LiDAR data. Because we can separate out trees, buildings and the ground surface we can calculate how the Sun’s light interacts with these features on any given day or over any time period. The purpose of this work was to complement the urban cooling maps. The cooling maps pertain largely to night time cooling as heat dissipates from greenspaces. The insolation maps, by definition, are about how surfaces catch the light from the Sun over a period of time. It would be nice to build a full 3D model of urban landscapes to model how trees shade buildings and how buildings catch the Sun’s rays and heat up, but this would be a very complex undertaking requiring a detailed knowledge of building materials of the roofs and of vertical building facets. What we can do is look at how trees shade building footprints to get a good indication of which buildings are shaded and roughly by how much. Here is an example of central Bristol of the Sun’s insolation and shading by trees and buildings over sunlight hours on the 29th July.
The image above uses the insolation values to show a shaded image, with places in shadow all day being very dark, whilst places not shaded are very light in tone. The shadows are not for a particular time of day but for all day on the 29th July, assuming a clear sky. You can see the way the shadows swing around individual trees during the course of the day. These values of insolation, or more specifically irradiation, mean something and are measured in Watt hours per square metre [Wh.m-2]. We can colour these values in ways other than a shaded map. Below the same map is coloured from blue to yellow to red with increasing values of irradiation, according to the colour ramp in the corner. There are no zero values because areas that are shaded all day received some diffuse radiation from the sky. The maximum value of irradiation is 8,290 Wh.m-2, or 8.29 kWh.m-2 on the 29th July.
You can see the way that open spaces with no shading receive the most solar irradiation, whilst street canyons with tall buildings may receive considerably less, depending on their orientation. Street canyons may be cool but the buildings with their vertical faces, which are not shown, will have caught the sun and are likely to be hot. Streets oriented east-west tend to be less shaded than those oriented north-south. The high open space values in Brandon Hill Park are moderated by tree canopies and their shade.