According to the National Forest Inventory, which records areas of woodland greater than 0.5 ha in size, the percentage are of woodland cover in the Chew Valley is approximately 7%. That figure is comparable with the national level figure of 10% for England and 13% for the UK as a whole. So the Chew Valley has much less than the already low national average. Compared with most European countries this is very low.
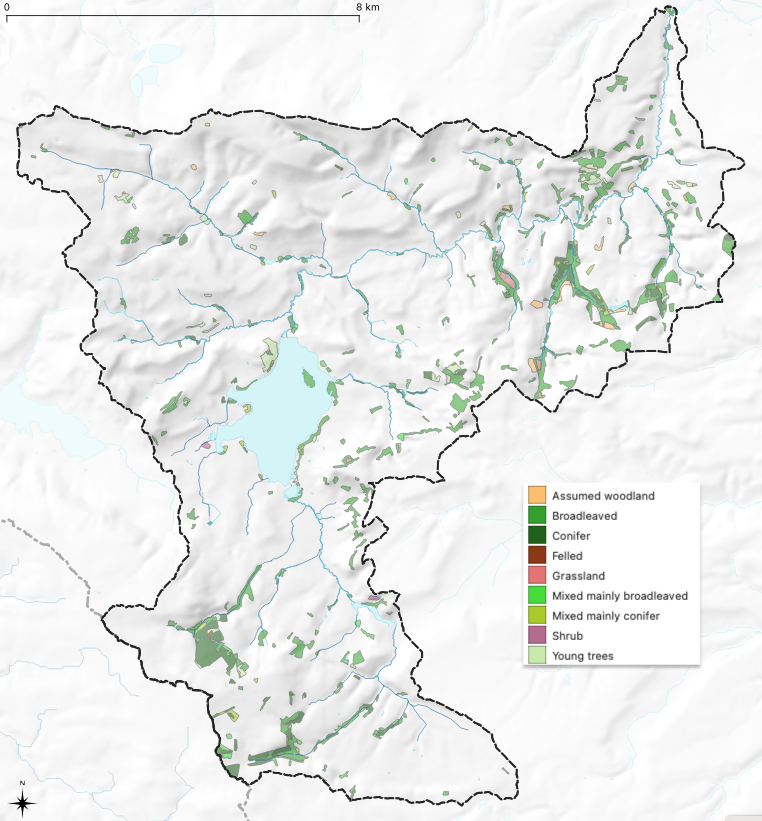
If we also consider small-woods (less than 0.5 ha) and individual trees in hedgerows and fields then the percentage cover figure climbs to about 13%, nearly double the NFI number, but still only the UK figure.
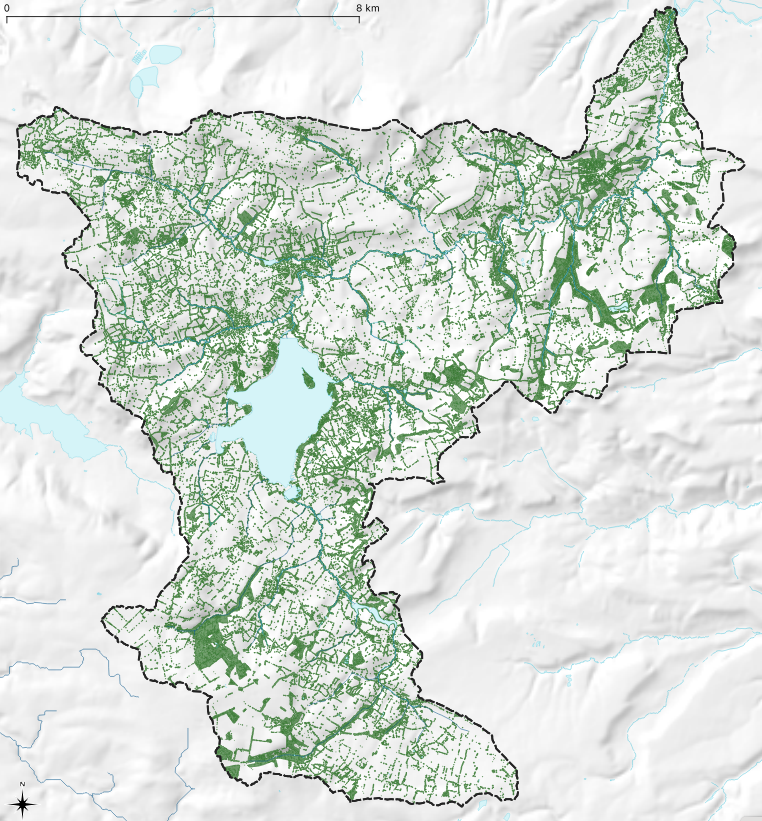
Despite the low woodland figure there have been numerous new areas of woodland planted in the Chew Valley since the 2018 inventory. So the figure should start to climb as the trees grow and start to show on the map. The map below shows where trees exist now and areas where they may be introduced in red. The red areas avoid arable crop land, protected areas and priority habitats according to the woodland opportunity mapping methodology.
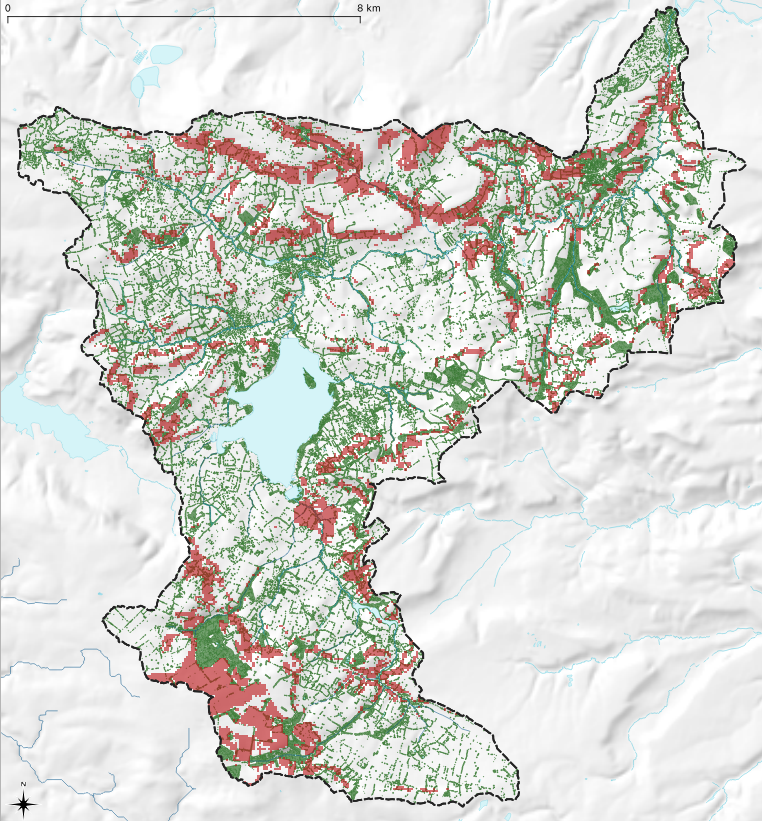
Both the LiDAR tree canopy map and the woodland opportunity map were prepared at the England scale for Friends of the Earth.